Ad blocker detected: Our website is made possible by displaying online advertisements to our visitors. Please consider supporting us by disabling your ad blocker on our website.
The long of it:
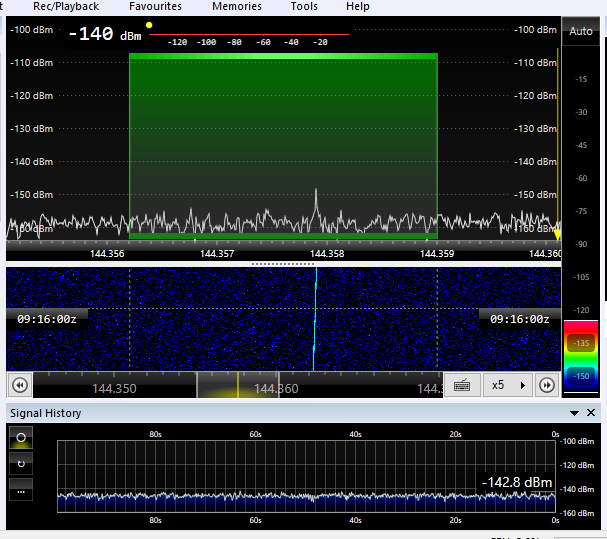
You have, roughly, a 3 kHz bandwidth for the S-Meter. You have a signal a touch over -150 displayed and a noise level, per pixel, of maybe about 15 dB lower level. The 3 kHz bandwidth is about 300 pixels wide. If you add all the noise in that 3 kHz bandwidth you get 300 times the total noise. That would add 25 dB to the noise placing the "signal" 10 dB into the noise. Simon's S-Meter algorithm is sort of funky, and in my gentle opinion broken, so instead of reading something like -135 it is reading much lower.
The short of it:
You are reading total noise power in a bandwidth much larger than the signal.
Set the bandwidth down to 100 Hz and see what happens,
Still, he has a 3 kHz bandwidth with the very narrow signal just barely over the noise. So I'd expect to see an S-Meter reading well above the signal peak on the spectrum report.
{^_^}